Unit 4 Visualising with Technologies in Education
Unit Overview
When I began my professional life as a biology teacher, diagrams, sketches, drawings, pie charts, histograms and still and moving pictures were a part and parcel of my toolkit. Without these I would have found it extremely difficult to describe the passage of food through a body's digestive system or describe the shape within a cell. Illustrations and pictures helped, as did pie charts and histograms, when I was trying to present frequency data of one phenomena or another (e.g., the weight and height of the young people in class). As teachers, our reliance on these tools was very high. What we are doing through these illustrations is to graphically display information, and the reason behind doing this is because it helps learning and supports teaching. This, in simple language is visualisation.
Many people recognise that each person prefers different learning styles and techniques. Learning styles group common ways that people learn. Everyone has a mix of learning styles. Some people may find that they have a dominant style of learning, with far less use of the other styles. Others may find that they use different styles in different circumstances. There is no right mix nor are the styles fixed. One can develop ability in less dominant styles, as well as further develop styles that are already in use.
Two educators, Richard Felmer and Linda Silverman developed an Index of Learning Styles in the late1980s. This is a widely used model to measure the styles of learning. The model assigns four dimensions of styles which are a continuum from one end of a string to the other. Felmer revised the original index as presented in the Figure 4.1 below..
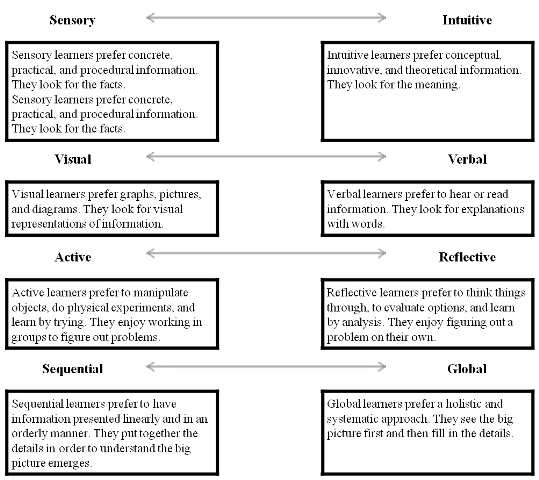
Figure 4.1 Felder and Silverman's Index of Learning Styles
Source:
http://www.mindtools.com/mnemlsty.html
Using multiple learning styles and multiple intelligences for learning is a relatively new approach. This approach is one that educators have only recently started to recognise. Traditional schooling used (and continues to use) mainly linguistic and logical teaching methods. It also uses a limited range of learning and teaching techniques. Many schools still rely on classroom and book-based teaching, much repetition, and pressured exams for reinforcement and review. A result is that we often label those who use these learning styles and techniques as bright. Those who use less favoured learning styles often find themselves in lower classes, with various not-so-complimentary labels and sometimes lower quality teaching. This can create positive and negative spirals that reinforce the belief that one is "smart" or "dumb".
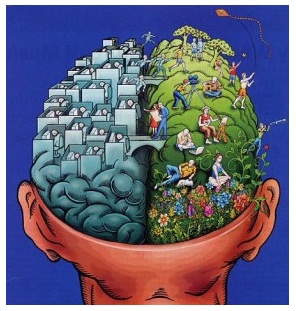
Figure 4.2 Left-brain:right-brain
Source: vaXzine
Figure 4.2 illustrates the complexity of the various types of human behaviour presumed to be ‘controlled' by the different parts of the two hemispheres (the left and right hemispheres). I say presumed because despite all the studies that that have been carried out over the decade, science cannot say with absolute certainty that the two sides of the brain though similar in its anatomical structure have different functional roles. Popular psychology often ascribes the left side as ‘logical' and the right as ‘creative' - for now it is best to say that much more investigation is needed. However this uncertainty has not discouraged behavioural scientist from speculating the role of the brain in learning.
Using studies of the brain as the basis, some researchers and theorists are beginning to claim that those with a particular preference of learning style will benefit best in their learning if content is presented to them in a format mostly closely aligned to their style of learning. I have tabulated below the preferred medium of four types of learning styles. There are a number of tests available to determine one's learning style. Some of them are freely available on the web should you wish to test yourself. In Table 4.1 I have listed some popularly ascribed traits on learning styles. Go through Table 4.1. Are you able to determine your learning style?
|
Auditory: |
Visual: |
|
Kinesthetic: |
Tactile: |
Table 4.1 Four styles of learning and their preferences
There are many theories behind our beliefs about the power of visualisation in helping learning. We are also beginning to see an increasing use of visualisation at all levels of education. One of the most fascinating examples of the power of visualisation in learning is a lecture delivered through TED TALKS (http://www.ted.com) by a Professor of Global Health at the Karolinska Institutet, Sweden, by the name of Hans Rosling, on Global Health and Poverty. The man made ‘data sing' as one person put it. His presentation of hardcore statistics on global poverty almost makes the study of statistics.Hans Rosling's new insights on poverty
Source: http://www.ted.com/talks/hans_rosling_reveals_new_insights_on_poverty.html
The difference between what I was able to do as biology teacher and Prof. Rosling (besides his enormous talent) is the intervention of the new technologies which has not only made it possible to present data visualisation in a dynamic way but also empowered many teachers to accomplish this either as simple PowerPoint presentations or dynamic moving presentations.
By the end of this unit, you should be able to:
- Discuss the theories behind visualisation and the values and benefits it brings for education.
- Illustrate with examples, the technologies, both hardware and software behind visualisation and the appropriate application of these in classrooms.
- Analyse and assess the application and value of visualisation in language instruction.
- Describe and illustrate the application of visualisation techniques in illustrating mathematical ideas and concepts.
- Determine with illustrations the application of visualisation in presenting scientific concepts, practices and ideas.
- Describe and argue a case for the value of games and simulations in teaching and learning.
Licensed under the Creative Commons Attribution 3.0 License